What can you do on a flight? Well, you can take a nap or read an onboard magazine. One of not so obvious options is to connect to internal aircraft Wi-Fi and check which resources you can access without paying anything. On one of the latest flights, I clicked here and there and found API endpoint, which looks like this: https://www.airline-flynet.com/fapi/flightData (airline name was changed, just in case). On this endpoint, we have quite a lot of interesting data in JSON format. The most exciting thing about this data is the fact it is available only when you’re onboard, and is not available from the “everyday” internet.
{
  "lon": "xx.xxxxxx",
  "lat": "xx.xxxxxx",
  "groundSpeed": 443,
  "heading": "xx.x",
  "internetAvailable": true,
  "aircraftType": "A320",
  "aircraftRegistration": "AB-CDE",
  "elapsedFlightTime": "02:30",
  "orig": {
    "lon": xx.xxxxxx,
    "lat": xx.xxxxxx,
    "code": "ABC",
    "localTime": "2018-10-XXTxx:xx:xx"
  },
  "dest": {
    "lon": xx.xxxxxx,
    "lat": xx.xxxxxx,
    "code": "XYZ",
    "localTime": "2018-10-XXTyy:xx:xx"
  },
  "distDest": "xxx.x",
  "altitude": 38344,
  "temperature": -53,
  "flightNumber": "AB111",
  "clearRoute": false,
  "displayProjectedPath": false,
  "utc": "2018-10-XXTxx:xx:xx",
  "displayPA": false,
  "arincAvailable": true
}
I hid some pieces of information intentionally. This data is dynamic, so we can gather dataset by fetching data with some fixed interval. Here is the dumb script, which does exactly what we want:
while true ; do
    curl https://www.airline-flynet.com/fapi/flightData > $(date +%s).json
    sleep 30
done
Of course, I discovered this aircraft “feature” in the middle of the flight, so I gathered only “half” of possible data. From my perspective, the most interesting values from the JSON are groundSpeed, altitude and temperature. As it turned out, groundSpeed is expressed in knots, altitude is in feets, and temperature in Celsius degrees. So, we can make some graphs from this dynamic values.
After gathering data, we need to filter needed values from a lot of *.json files, using simple script:
:>data.csv
for FILE in *.json ; do
    jq -r "[.altitude, .groundSpeed, .temperature] | @csv" "${FILE}" >> data.csv
done
After running the script, we got these datapoints in data.csv:
38349,424,-60
38347,424,-60
38358,424,-60
38355,424,-60
38360,424,-60
...
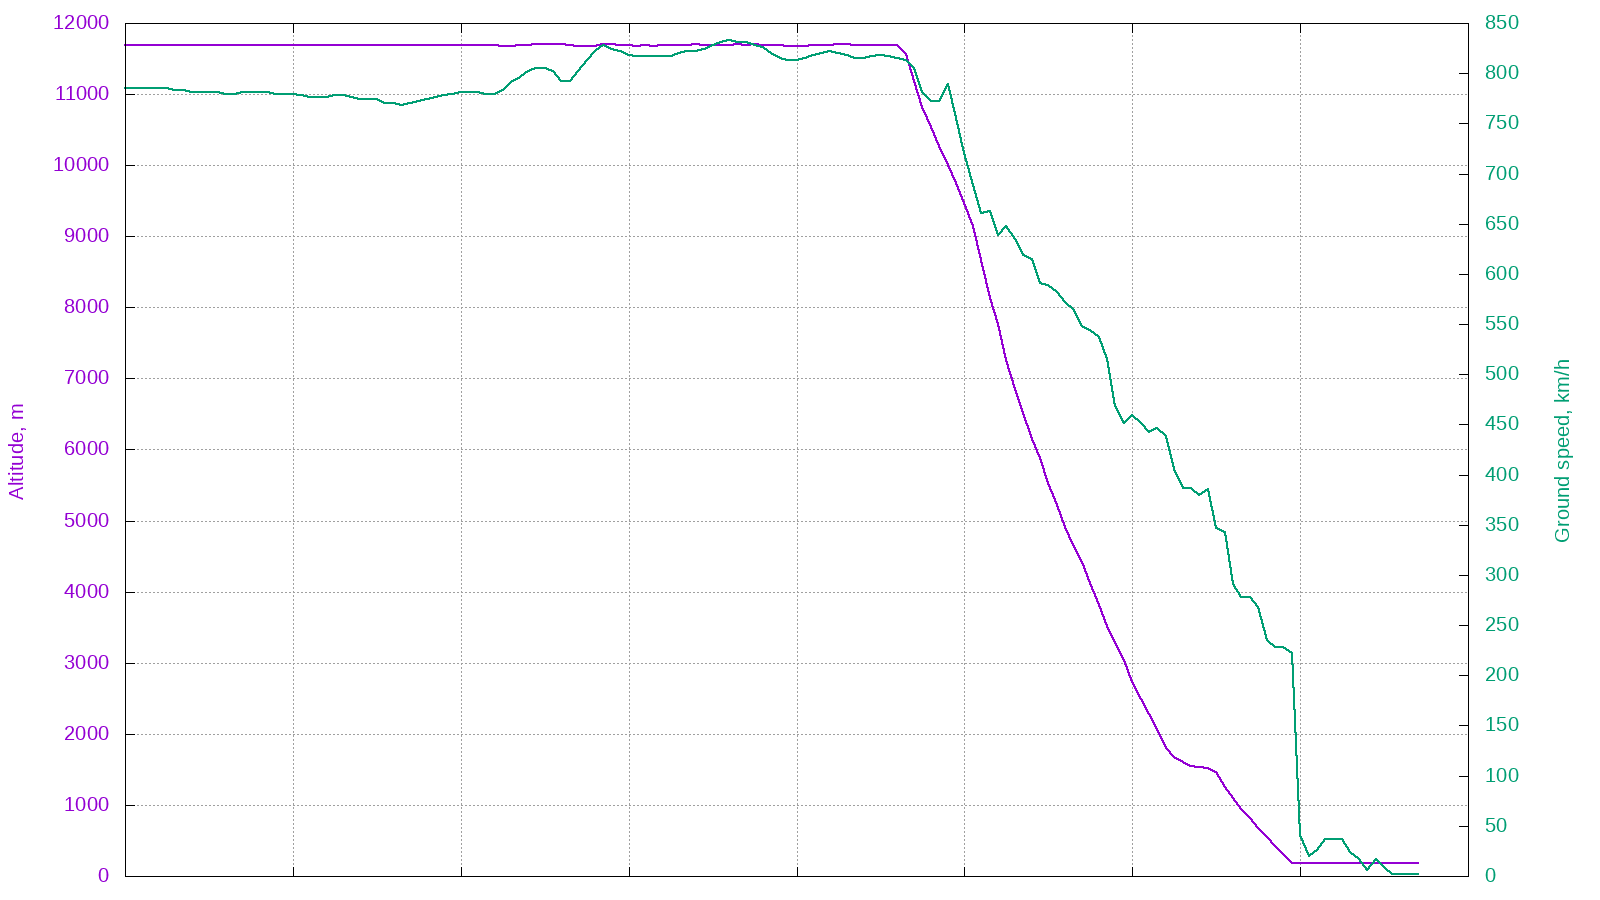
For graphs I used my favourite tool, Gnuplot. One small thing, I converted all values to metric system. Notice that altitude was steady throughout almost whole flight. Also, it is easy to notice landing preparation and the landing itself:
Now, to the temperature. It is cold outside, huh?
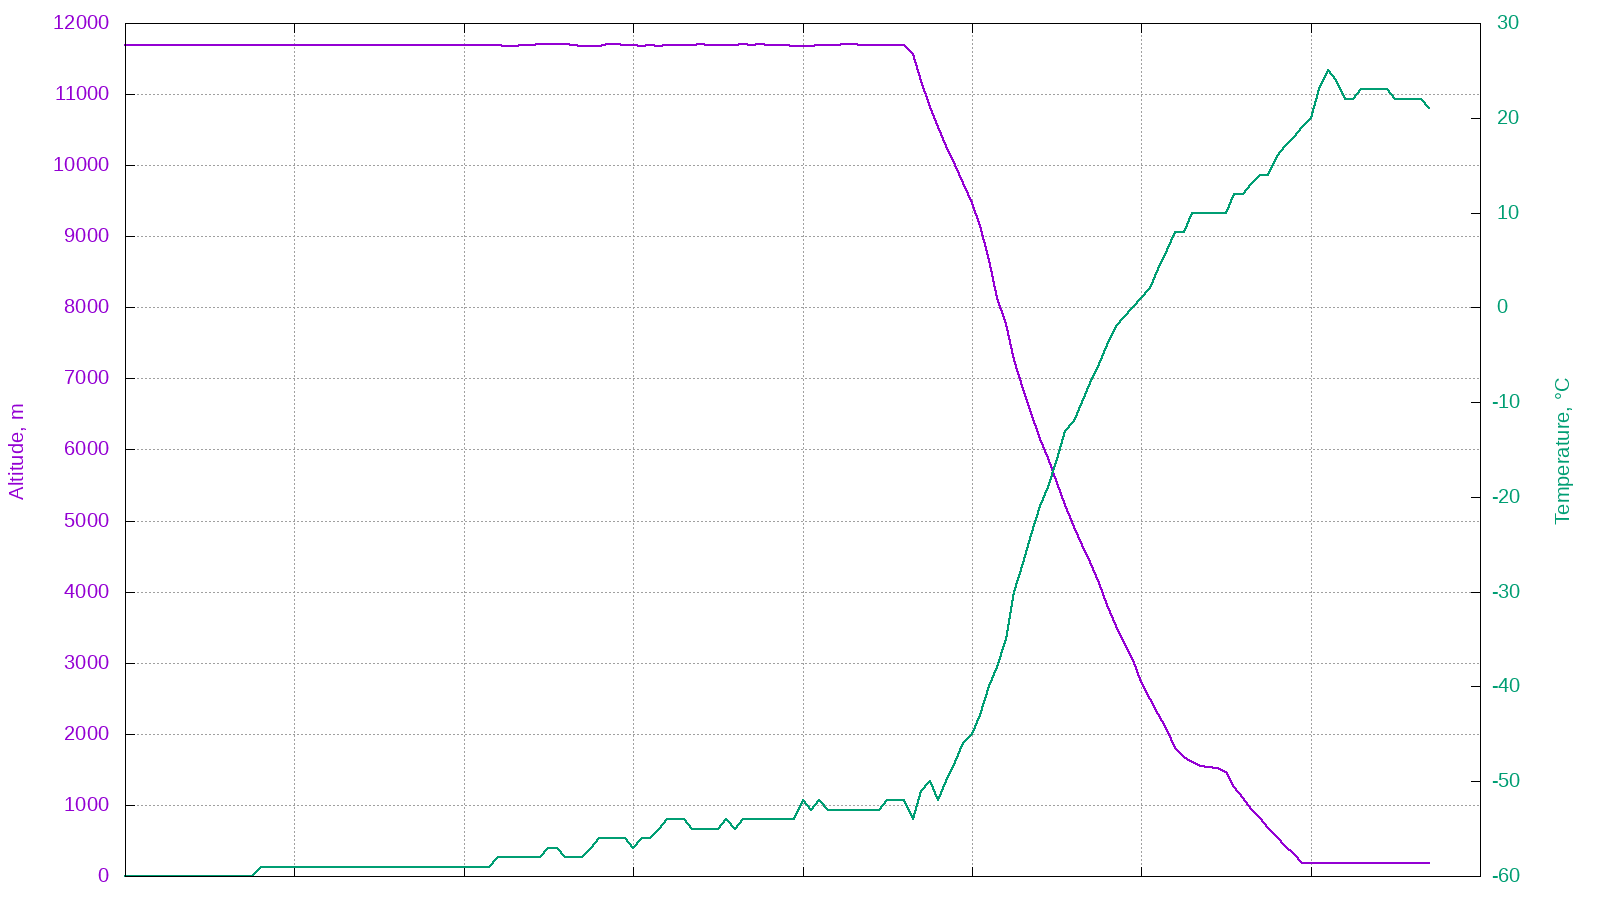
Gnuplot scripts: altitude/groundSpeed and altitude/temperature.
Have fun flying high!